
meaningful electoral options
Broad representation, strong voter participation, and competitive elections indicate a healthy democracy. Since 2002, nearly half of Portland City Commissioners were elected with support from less than 25% of registered voters, and only four races were competitive. This trend is linked to primary elections deciding most City Commissioner and Mayoral races over the past couple of decades. Low participation in these primaries meant relatively few Portlanders determined who would represent the city. Starting in 2024, city races no longer have a primary.
The 2021-22 Charter Commission aimed to broaden representation on City Council and avoid one electorate making decisions for another.
tracking this goal:
One year of elections won’t be enough to establish trends or identify the root causes for electoral competitiveness or voter support for elected leaders. Several years of data will be needed to accurately assess the impact of the new elections system. Learn more about the kinds of data we’re using, and how to include it in responsible analysis.
Important to know about this data: This data is based on all the registered voters who supported the winning candidate. The number of registered voters is typically larger than the number of voters who cast a ballot in a specific election, and in city races and primary races the difference can be significant. Many registered voters do not participate in primary elections at all, and those who do sometimes vote for a candidate in a statewide or Federal election, but not in local government elections. As result, many local races were decided by more than 50% of the vote, while earning support from fewer than 25% of all registered voters.
About these dashboards: Explore this rich data set by adjusting filters, hovering over graphs and charts to see more data details, and clicking to isolate specific data criteria.
Learn more: Scroll to the bottom of this page to dive deeper into the stories the data tells.


About this data: 2024 data were originally published by the Multnomah County Elections Office here.
getting into the data and trends
background
The Portland Charter Commission’s desired outcomes included interest that voters would “have more choices and more opportunities to elect their preferred candidate” and would “feel their choices matter.” “The Charter Commission also hoped to ensure that “one electorate doesn’t set up choices for another electorate.”
what indicators do we track?
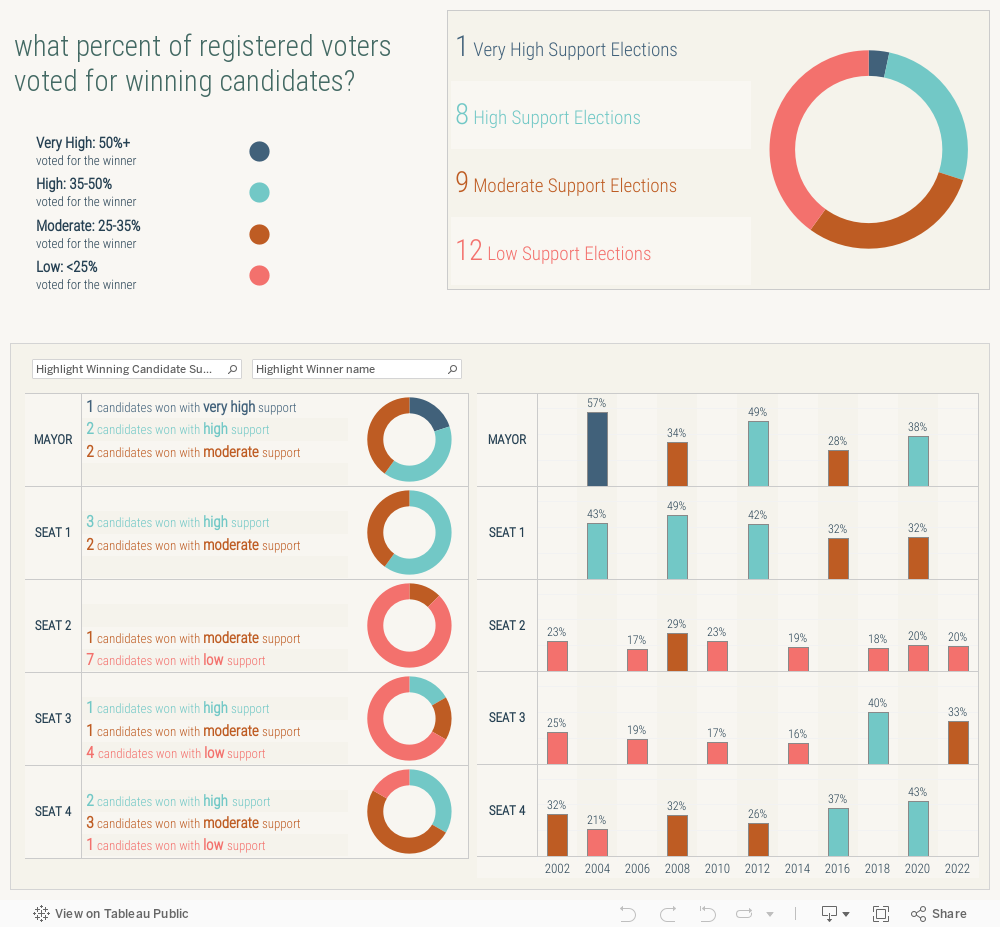
Voter support for winning candidates: We calculate the percent of registered voters who voted for the winning candidates in each election. This metric reflects the overall support of an elected official. It takes into account voter turnout and candidate popularity with voters.
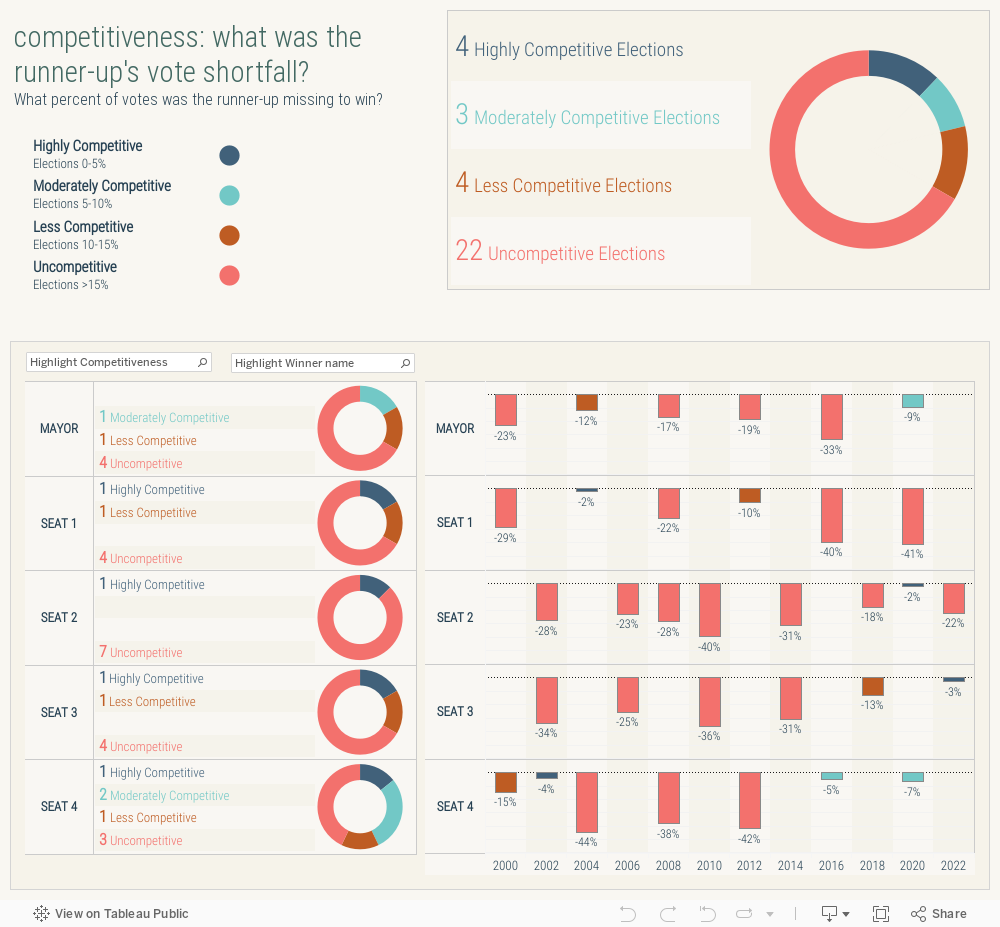
Competitiveness: We use competitiveness, or the shortfall in votes that the runner-up would have needed to win the election, as an indicator of voter choice. To compare electoral competitiveness across different election types (such as first-past-the-post and ranked choice voting in multi-member districts), we adopted a metric created by Stanford professor Gary Cox in 2019 to measure the smallest change in votes that would result in a different election outcome.
about the data
Units of Measure: (1) Percent of registered voters who cast a vote for the winning candidate (2) Runner-up vote shortfall
Period of Time: 2000 - 2022
Definition:
(1) The number of votes for the winning candidate divided by the number of registered voters
(2) For a single winner election, the runner-up vote shortfall is the difference in the number of votes the 2nd place candidate received minus half of all valid votes in the contest, divided by the total number of votes cast in the contest. The closer the shortfall is to zero, the more competitive the election.
Source: Portland City Elections Results
Type of Data: Elections data
Geography: Portland, OR
good to know
As of 2024, Portland offices no longer have primary election contests.
other resources
PDX Charter Facts (a North Star Civic Initiative): The May primary has decided 66% of outcomes in Portland city council and mayoral races since 1970 (source), (source). By eliminating primary elections and moving them to the fall, when Oregon voters turn out in high numbers to participate in Presidential or Gubernatorial elections, overall voter participation in city council member elections will likely increase (source).
what the data shows
-
Since 2002, 40% (12 out of 30) of Portland’s City Council members have won their elections with votes from fewer than 25% of registered voters. This is in part because many council members won their seats during primary elections, when relatively few Portland voters turn out to vote.
-
Like other nonpartisan elections in Oregon, candidates for Portland City Council used to be able to win outright during a primary contest if they received more than 50% of the votes cast. Unlike candidates who did not meet the threshold, these winners could forgo the November general election.
This meant that even if most registered voters skipped the May primary, City Council members often were elected by the minority of voters who did participate.
Contests for Council Seats 2 and 3 were almost always decided in the primary and only rarely made it to the November general election. Voters elected Portland's Mayor in the primary about half of the time.
Under the changes enacted in 2024, Portland will no longer host primary elections, and will instead elect leaders using ranked choice voting during the November general election.
-
Since 2002, only four City Council races have been competitive. The vast majority of races have not been competitive, with the second highest vote-getter lagging more than 15 percentage points behind the number of “votes needed to win” in each race.
-
Competitive elections can be an indicator of a healthy democracy. Voters have diverse opinions. When a diverse field of candidates represent those opinions in compelling ways, voters see more options and more reason to participate in the electoral process. This both propels voter participation and fosters more dynamic community conversations about the issues that matter.
That said, instances of uncompetitive elections do not necessarily mean voters lacked diverse and representative options. Sometimes, candidates win by a landslide due to their sheer popularity and because their platforms resonate with many voters. Election competitiveness should therefore be analyzed in concert with other metrics, such as overall voter participation and support for winning candidates.
-
In Portland and across the country, voters of all ages participate in elections at lower rates during midterm years than during presidential election years. Likewise, fewer voters participate in primary elections than in general elections.
Several factors contribute to lower turnout in primary elections:
In Oregon, closed partisan primaries exclude more than half of all voters under the age of 40, and more than half of Latin@ voters, because both of these groups are less likely to affiliate with a political party. As a result, young and Latin@ voters will not be contacted by campaigns during primaries.
In general, political campaigns spend less money on voter outreach during primary or special elections than during the general election in November. This means that most voters get fewer "touches" reminding them to vote or engaging them in the electoral process.
Although local government elections are typically non-partisan races, fewer voters understand how local governments work or what local officials do. As a result, they are less likely to participate in local elections during the May primary.
Starting in 2024, Portland will no longer hold primary elections for local contests such as City Council and Mayor. Portland voters will only vote for these positions during November general elections. The Portland’s Charter Commission hoped that by eliminating primary elections, more voters would weigh-in on election outcomes.